27/11/2022 7:32 pm
Topic starter
1
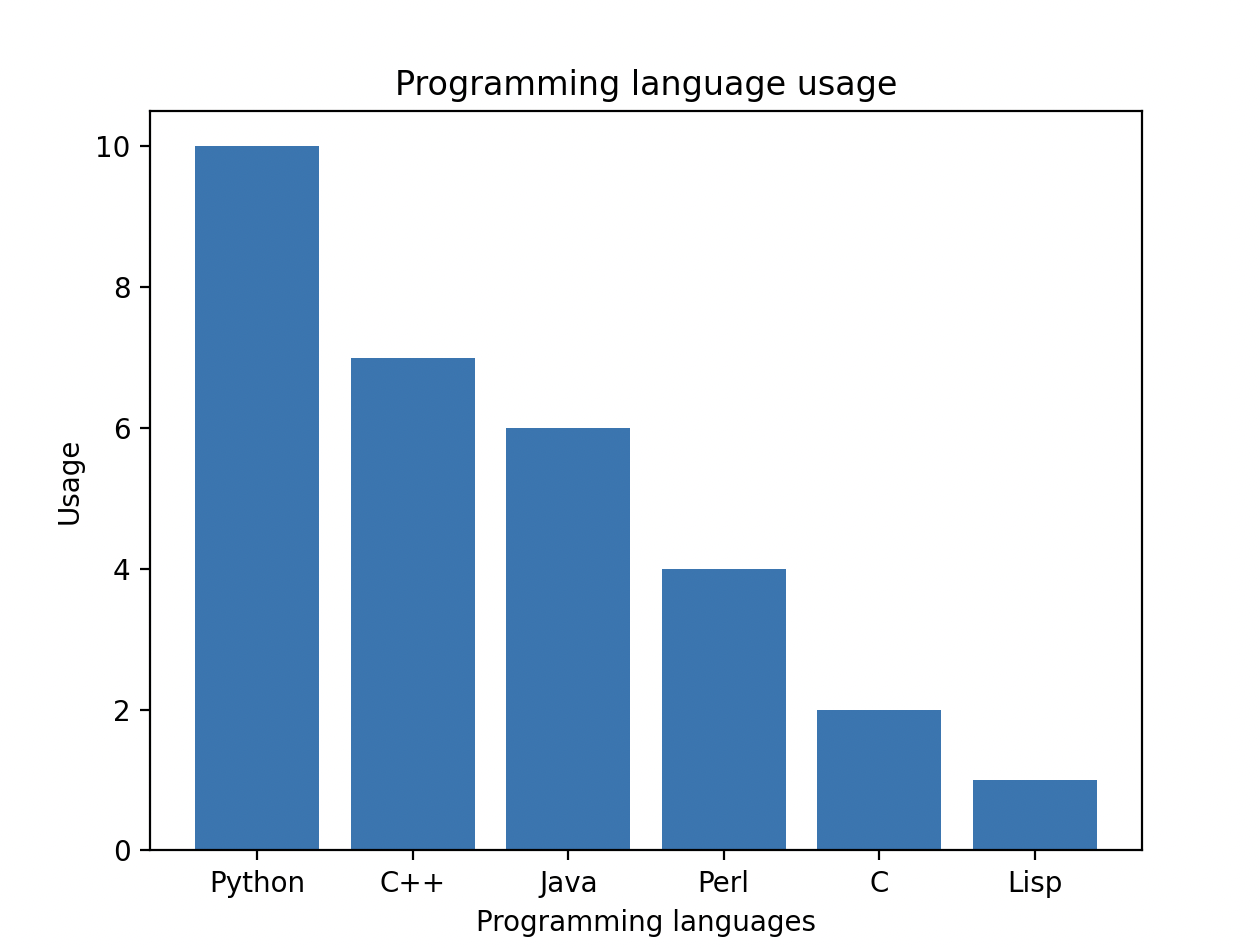
Plot a bar chart to depict the popularity of various programming languages
1 Answer
1
27/11/2022 7:34 pm
Topic starter
Code:
import matplotlib.pyplot as plt
import numpy as np


prog_lanugages = ('Python', 'C++', 'Java', 'Perl', 'C', 'Lisp')


x = np.arange(len(prog_lanugages))


performance = [10,7,6,4,2,1]


plt.bar(x, performance)


plt.xticks(x, prog_lanugages)
plt.ylabel('Usage')
plt.xlabel("Programming languages")
plt.title('Programming language usage')
plt.show()
Output: